

Full Stack Friday Vol.1
Why is Big Data Imporant?
Welcome to the Very First Full-Stack Friday Post. This week the what we will be covering is a topic of a lot of importance in the Computer Science Industry today. Data Science. Data Science is used as a means to make sense of Data whether it be for equity analyses, pricing schemes, or inventory maintenance and management. 90% of the all of the organized data in the world has been created within the last two years. Big Data (Structured and Unstructured) Is the way of the future as the more access to data you have, the better you can understand what markets you want to hit, what products you should buy more or less of, as well as any aspect to make your business more efficient.
What we will be covering
In this intro tutorial we will be talking about how to set up Anaconda for python on your linux machine, as well as Intro statements to get you started with visualizing data.
Installing Anaconda
I had some troubles installing Anaconda as I have an older version of Ubuntu and it
is a relatively newer technology. For installing with Windows, refer to the
Anaconda documentation page at http://docs.anaconda.com/anaconda/install/windows/. If
you are installing on MAC OS, refer to the Anaconda documentation page at http://docs.anaconda.com/anaconda/install/mac-os/. If you are installing on linux however hold
tight to your seat because this is going to be very easy. First open your terminal window in your
main directory and write in the code $wget https://repo.continuum.io/archive/Anaconda3-2018.12-Linux-x86_64.sh.
After you have this installed, immediately you should see that there is a license agreement. Hit ENTER on your keyboard until you see the option to hit ‘yes’ or ‘no’. Accept the license and set the default path location for the directory.
Running Anaconda Navigator
To run Anaconda Navigator can be a little tricky on most linux systems since it acts as a host for all of the web applications it comes with. You want to CD into the user directory and enter source ~/anaconda3/bin/activate root… After you should see regular tag on the Command line preceded by root in parentheses. After you see that you can enter anaconda-navigator. This is going to open anaconda navigator with the logo you see posted at the top of the post. After that you should see this interface. We are then going to get into how to actually use these applications.
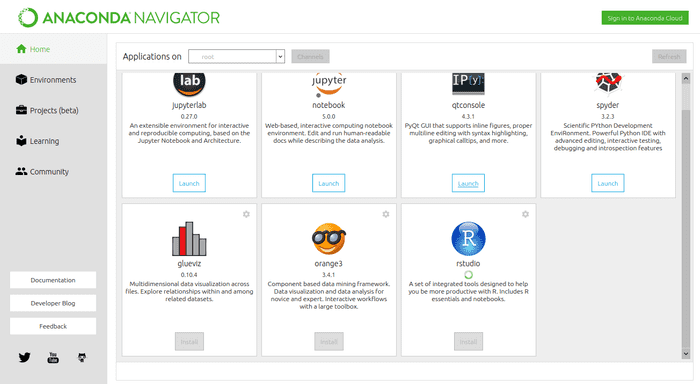
Using Jupyter Notebook and matplotlib library
First thing you want to do when you get to the page above you want to Launch Jupyter Notebook. This is the application that is going to allow us to visualize our data. below is a sample program that is going to allow us to us the values in two lists ‘x’ and ‘y’ to create a graph in jupyter:
import matplotlib.pyplot as plt

year = [1950, 1948, 1938, 1987]

pop = [2.519, 3.692, 5.263, 6.972]

plt.plot(year. pop)

plt.show()
First thing we do is take in the matplotlib.pyplot library and use it as plt. we then set the values for our years as items in a list. Then we set the values for population in another value and store it as pop. We then see the line ‘plt.plot(year, pop)‘. What this line does is set the year as the values on the x-axis and sets the pop values on the y axis. This is going to give us a line graph. We then use the plt.show() function to display the graph.